

Building an event stream


I'll admit it; I have a bit of an event stream fetish. I've been toying with getting all the state in one place for a good 10 years now. The latest version of OpLog is the metamorphosis of the original Oplog, which was built on straight python CGI and mysql and email as the ONLY vector of input, but many outputs: UI, RSS, even clients written for windows and mac using growl and.. whatever that windows growl thing was. Of course, any time you try to create an event stream/archive, you run into all kinds of issues; space constraints, indexing issues, and UI to name a few. My current company uses google business for our mail and to ensure everything was getting to where it needed to be, I ended up popped mail from a centralized gmail box and jamming it into elasticsearch, which stood under a thin RSS layer. Any time you try to get everything into one place, things get a little Rube Goldberg.
We have a long and sordid history at my company, including a LOT of legacy code and process that's still in place, so when I talk about "all of the things", I'm talking about input from nagios, sensu, zabbix, seyren, pingdom, logstash, rundeck, and another billion one-off scripts and notifications that have accumulated over time. Yes, we really run 3 tier-1 monitoring systems, but eventually we're planning on consolidating to sensu + flapjack + graphite for alerting, trending and notifications, but that's currently a work in progress. In reality it'll probably take a while to sort out the various cron jobs and other errata that have crept in over time, and if you can't beat 'em..
My latest stab at this domain is to simply offload a huge segment of that problem to someone else; namely slack. I'm not the first person to use and abuse slack for automated notifications. I'm pretty sure there are plugins for most automated systems to support it by now. Space, indexing, UI, for the low, low price of $15/user/mos I don't have to care about any of that anymore. People can subscribe to notifications, view, and search, all from an interface they're already familiar with and likely logged into. Problem solved! I started working on integrations and quickly found some things I didn't like about the API. For one thing, as I found myself entering the URL with the token in place after place I kept thinking, I hope I never need to change this. Spoiler alert, I needed to change it. I also didn't like the fact that I needed to make a call for each channel I wanted to post something to. I also found that I wanted a layer of interpretation for how to handle specific notifications. Intelligent handling is always a nice thing to have sitting on top of a dumb pipe.
Enter slack_gateway. and friends. This is my stab at a micro router, built atop my favorite micro-framework, bottlepy, for abstracting some of the things I didn't like about the slack API:
- submit to multiple channels from a single endpoint
- accept data from logstash from the default http plugin
- not have to expose and maintain the slack API endpoint in multiple applications
- do different things with different types of data
- handle per-channel posting across multiple teams
So now we have something like this:

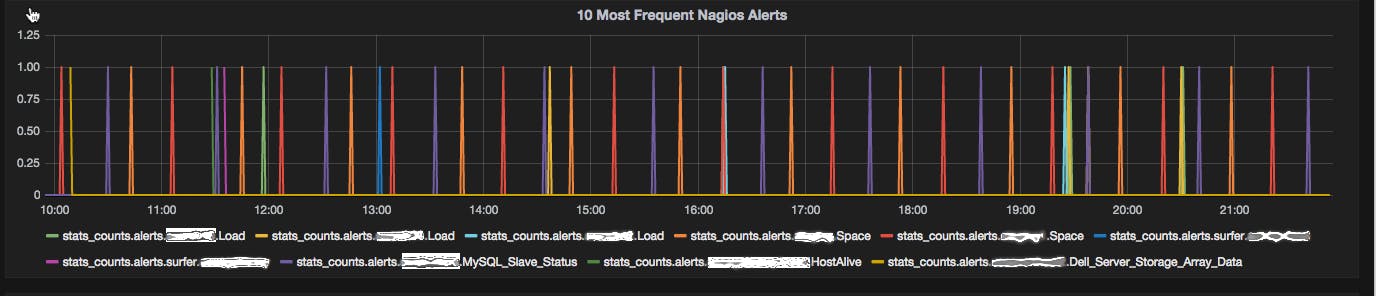
Once I had the gateway up and running and the spice was flow.. I mean, the data was flowing, and a lot of trends started appearing. Trending is awesome if you actually have someone dedicated to observing the data and analyzing trends. We don't have that. It's completely searchable and in history in slack, which is also nice, but again requires someone to go back and look at the data. I started thinking about useful applications for that data beyond real-time correlation, which is useful by itself (Hey, we always see a stack trace on the same cassandra node we get a high Await alert on first, and then it seems to cascade through the other nodes. Pretty great.) I figured since we have a logic capable layer sitting on top of the queue, maybe I should use that to do something interesting. Using a sprinkle of regex and a dash of statsd, I started generating counts of the alerts coming through, providing a nice target for grafana to serve up things like the Top 10 most frequent alerts I'm seeing in a given time period in a readily available dashboard.
I'm only about a week in on this endeavor but like any fun project the rewards are already evident. I'd like to encourage anyone who will listen, get everything together and turn it into something meaningful.